Six barriers to meaningful Customer Value Analysis – and how to get over them
There can be little doubt that understanding how ‘value’ is distributed across their customer base is important to virtually all commercial organisations. Reflecting the value of different customers in everything from channel planning to marketing campaign selections and customer segmentation is a major business performance enhancer. And yet, really good value analysis (or customer value management – CVM) is still, in my experience, rare.
Having developed value analyses and segmentation frameworks for many organisations in a wide range of industries there are 6 “reasons-not-to” that I hear more than others. These can result in no analysis at all or in results that are treated with a low level of confidence by the colleagues who need to be using them. So, I thought I would share these and some of the techniques I have used to address them:
1. We can’t agree whether ‘Value’ means Revenue or Margin
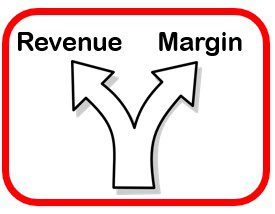 There is always a part of me that starts to answer this question by asking “Does it really matter?”. I have often put huge amounts of effort into creating solutions that enable both options to be delivered or changing from one approach to the other. The reality is that when the requirement is to deliver value groupings or segments we are interested in ‘relative value’ and not absolute value. So, whether customer A is 20 and customer B is 12, or customer A is 15 and customer B is 9, is not critically important.
In reality, and especially where there is a wide mix of profit margins across the portfolio, the difference between revenue-based results and margin-based results can be substantial. The answer as to which to use is very much dependent on individual circumstances. My experience suggests that the key factor is whether reliable and consistent margin-per-transaction can be extracted from transaction systems. If it can then use it. If it can’t then work with the Finance Team to agree a single margin percentage per product and apply this to the revenue figure. If this is also impossible then stick with revenue-based analysis.
2. The relative value of our customers changes with the time span we consider
 This usually manifests itself as the ‘current value’ versus ‘lifetime value’ dilemma. I have found that meaningful ‘Lifetime Value’ allocation is rare and even where it is analytically robust it is not universally understood or accepted within an organisation. The other challenge with ‘Lifetime’ value is that it changes slowly, making even dramatic changes in customer transaction levels difficult to represent.
So, it is far more common to work with some form of ‘current’ value. Even this can have different interpretations: Total Purchases Value over last 12 months; Current Subscription Value; Average Monthly Value etc. Many industries have commonly accepted definitions that help select the right version of Current Value. Where there is no obvious start point and where purchase cycles are normally measured in days, weeks or months I would always use Total Purchases Value over last 12 months as a start point.
3. The purchase cycles for our products are long which makes comparisons between customers’ value difficult
Where purchase cycles are long (e.g. Vehicle Purchase, Property Purchase, Machine Tools) the concept of ‘Current’ value can be misleading. If an individual customer buys a new car one year then we would not expect them to buy another one the following year, but should they then really be considered a zero-value customer?
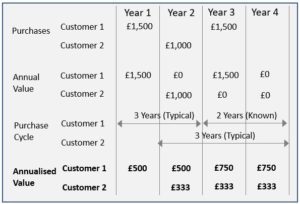 My approach to this has been to use a technique that I call ‘Value Annualisation’. It essentially means the distribution of purchase value across a known, predicted or typical purchase cycle. Simplistically, if a customer buys a car for £20,000 in one year and we know / expect them to keep it for three years then they are allocated an Annualised Value of £6,666. Needless to say, the calculations are a little more sophisticated than this, but not much.
4. We have a high level of customer churn so many customers are not active for a full 12 months in any one year
Even organisations with a static customer base size can have high levels of churn. I have worked with companies that have had the same total number of customers for many years and yet are seeing 15% annual customer losses and 15% annual customer gains. This means that 30% of their customers could be allocated an inaccurate value for the current year, resulting in under-estimates of overall value lost and gained.
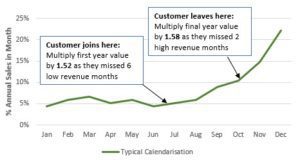 For these reasons I always use some form of calendarization in allocating full-year values to customers that have been won or lost during the current year. This goes further than, for instance, doubling the value of a new customer that was won 6 months into the year. It takes into account the natural variation that occurs in the company’s business. For lost customers this can be based on their individual pattern if they have been a customer long enough. For other lost customers and for new customers a typical calendarization can be calculated from the transaction data provided. This may vary depending on customer type or may have to be a single calendarization for all part-year customers.
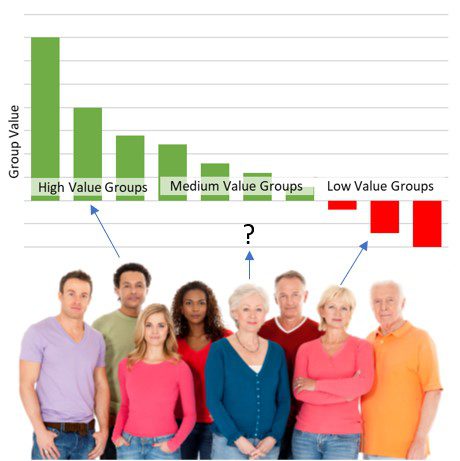
5. Customers often end up being allocated to a lower or higher value group than they deserve when we just consider their current value
Agreed, and I have lost many arguments when I take the line of “We have to put the thresholds somewhere”. I rarely take this simplistic view now. In all value analysis that I carry out I always propose the use of other ‘dimensions’ of value are considered in addition to current value.
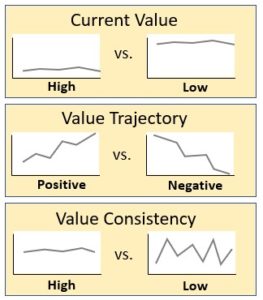 The most common additional dimension I propose is ‘Value Trajectory’ which is a simple representation of recent value increase or decrease and how steep this is. It is normally based on some simple form of regression calculation. This prevents customers being placed just below a value group threshold even though they will cross the threshold very soon.
A typical third dimension is value consistency which is particularly important to organisations that need predictability for production management or cashflow. Other dimensions have included breadth of product mix, average size of order and others.
6. It is almost impossible to extract complex customer transaction data from our systems
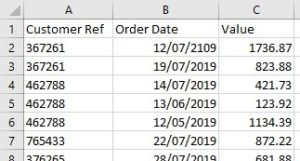 This is one of the most common objections to moving forwards with value analysis. The reality is that insightful value analysis can be built on very thin data. The example to the right shows the simplicity of data that can deliver good results. The most important thing is a customer code that enables all the transactions for a single customer to be joined together.
It is not even always necessary to have data at the transaction-by-transaction level. Data at various levels of aggregation can be used very effectively. For instance, value-per-customer-per-month.
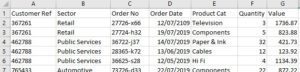 For even more insightful analysis it is useful to add in a small number of additional fields and a little more granularity so a great data set would like the one to the left.
Also, remember that it is not completely necessary to have any customer-related data at all. Even the customer reference number can be shielded to prevent any trace-back from analysis to individual customers.
In summary I would say that, despite having heard many reasons why it is very difficult for my organisation to carry out a useful value analysis, it has never proven impossible. Our Customer Value Segmenter tool addresses all these issues, whilst balancing precision with pragmatism. The reaction to the outputs invariably ranges from ‘interesting and insightful’ to ‘game-changing’.
Please get in touch if you’d like to better understand customer value in your business.

- Six barriers to meaningful Customer Value Analysis – and how to get over them - December 17, 2019


")


